Chart Mogul concept

About project

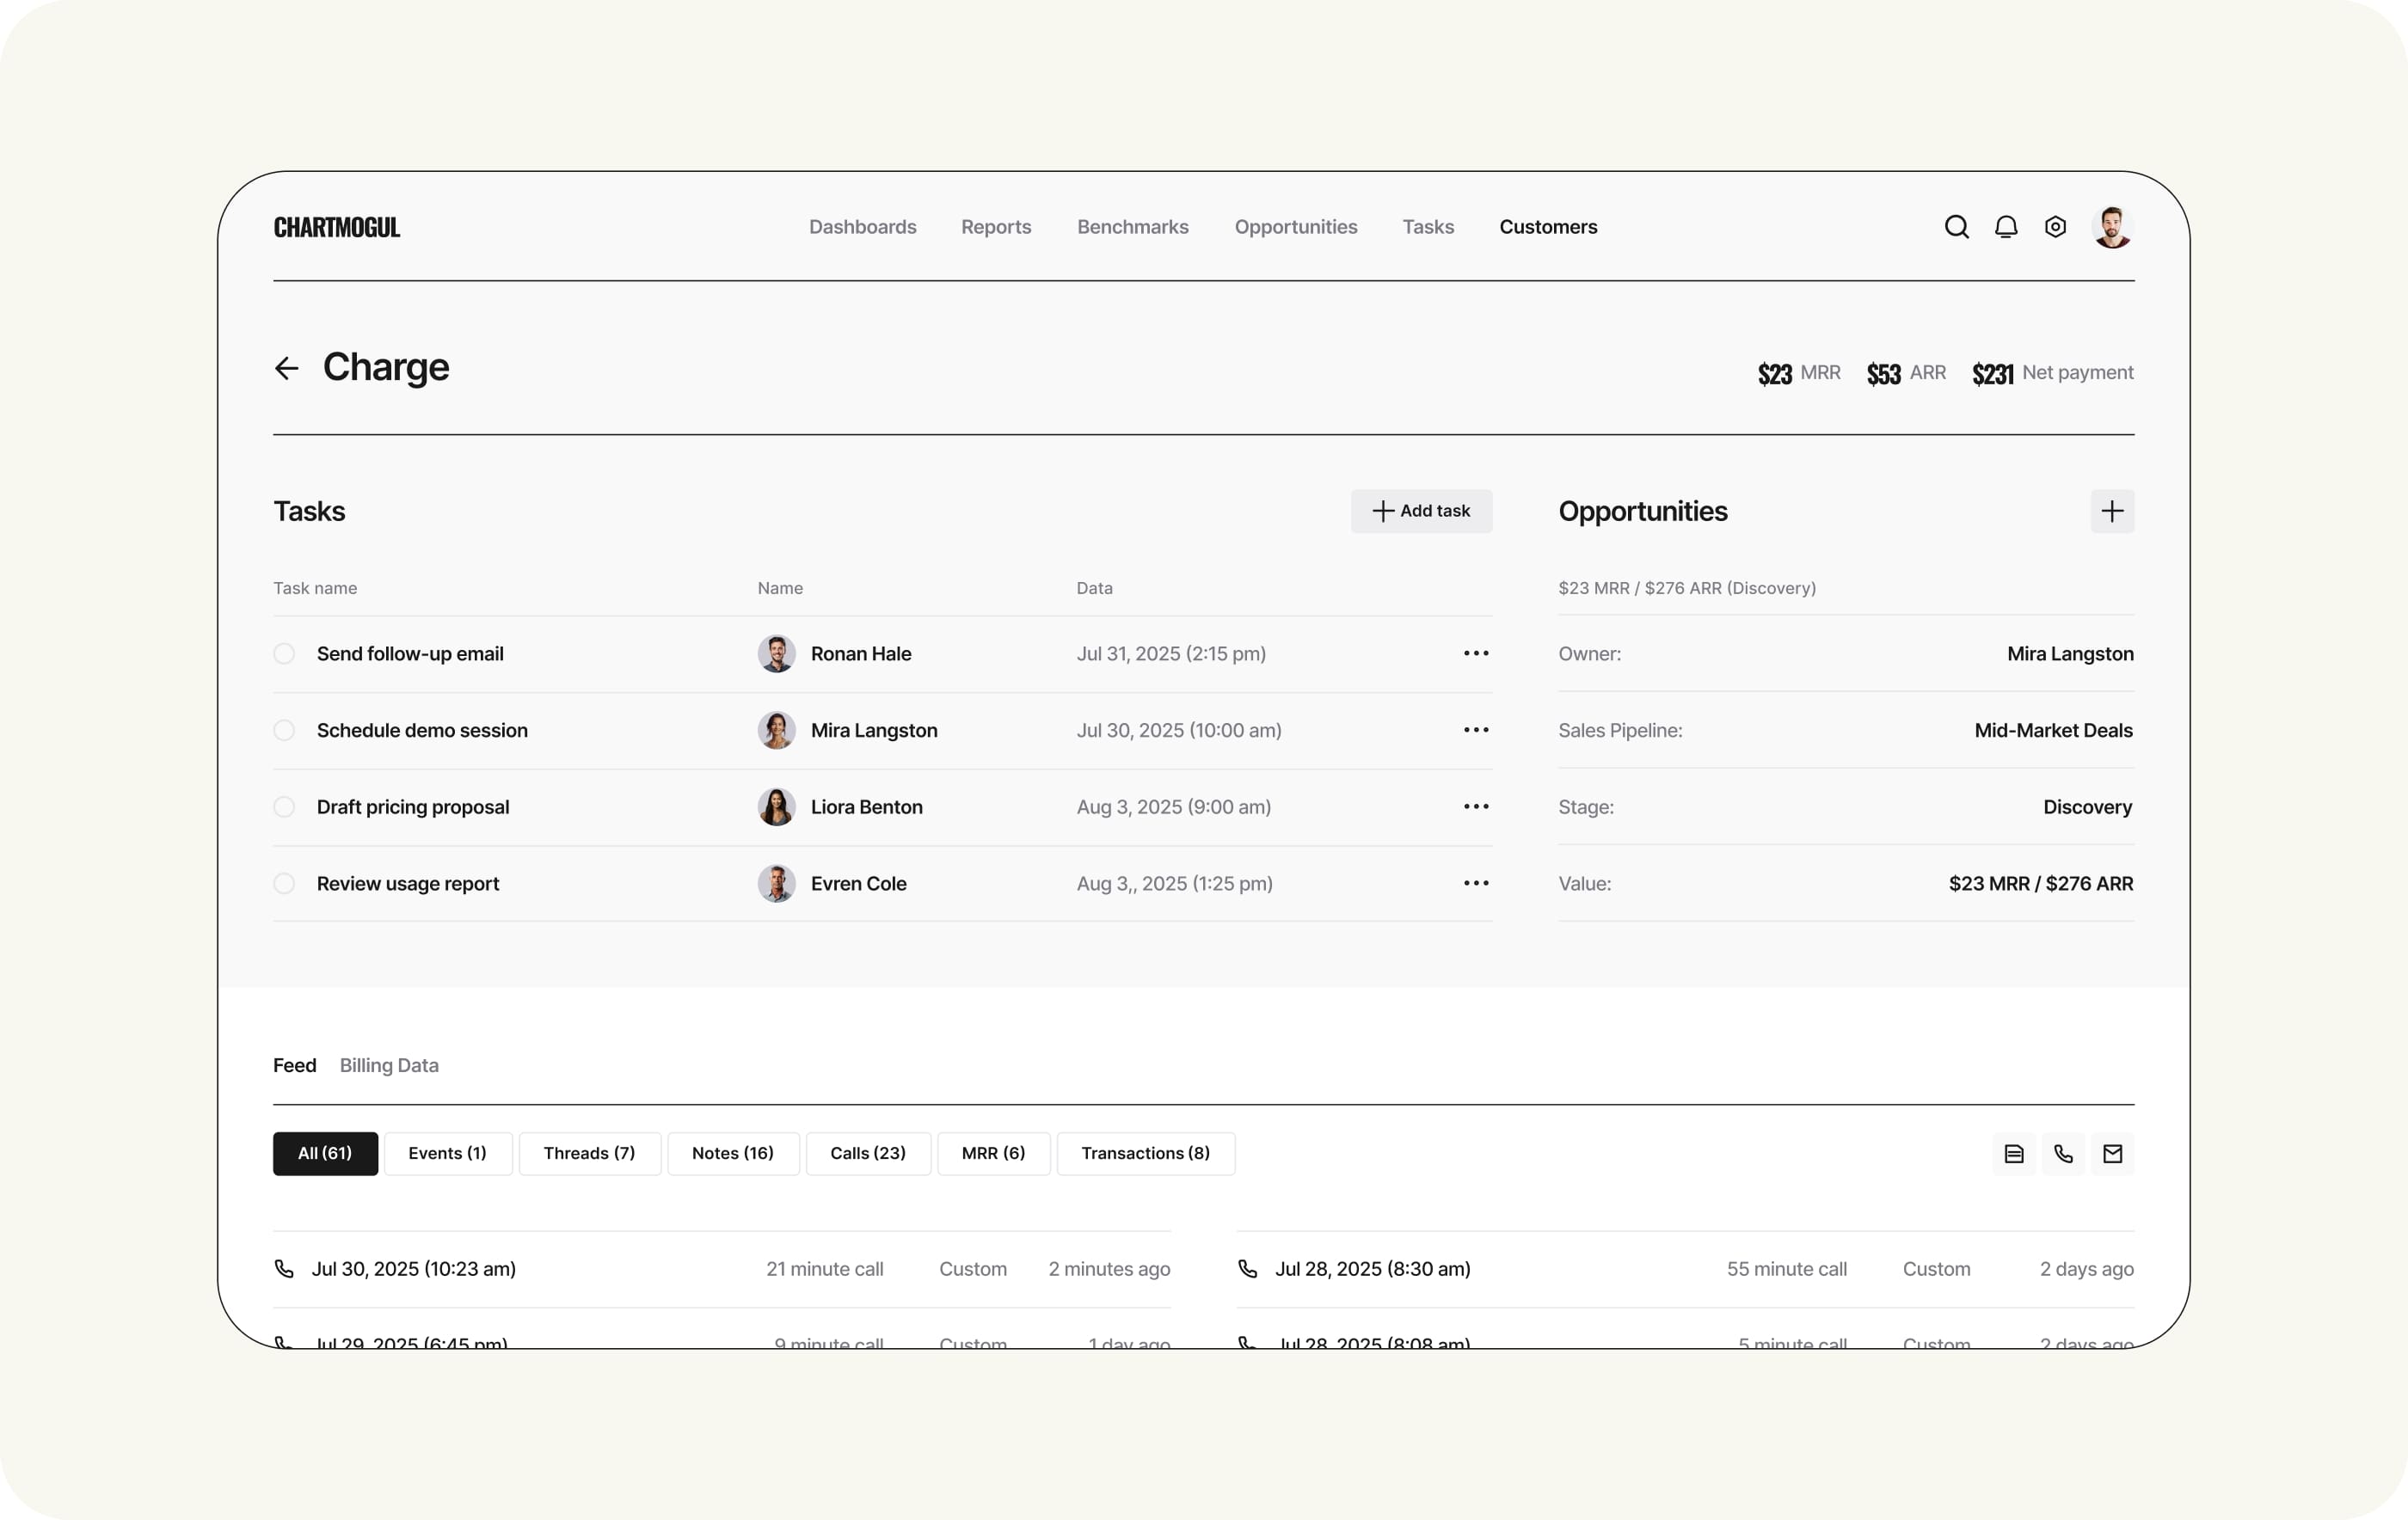
ChartMogul is a leading revenue analytics platform used by over 2,000 SaaS companies globally. This concept redesign reimagines the company’s digital presence to better reflect the platform’s powerful capabilities and modern approach to data visualization. Our concept focuses on reducing information density and simplifying navigation through a cleaner, more intuitive interface. We created a visual language that communicates ChartMogul’s value instantly, transforming how potential customers perceive and interact with the product.

The updated layout emphasizes clarity through thoughtful white space, streamlined user flows, and interactive elements that highlight key features without overwhelming users. By modernizing the visual identity and refining content hierarchy, this concept redesign positions ChartMogul as a premium, accessible solution for SaaS analytics teams of any size.

https://res.cloudinary.com/dvietp0lq/video/upload/v1764189236/Chart_Mogul_1_dtldig.mp4

Challenge

Problem
SaaS analytics platforms often struggle to balance depth with accessibility. Decision-makers need quick insights without technical complexity, while analysts require detailed data access. The challenge was to create a web experience that serves both audiences equally well, presenting sophisticated analytics through an approachable, modern interface.


Solution
Our concept introduces a dual-layer approach: surface-level clarity for quick understanding and deep functionality for power users. Interactive visualizations demonstrate product capabilities in real-time, while smart information architecture guides different user types to relevant content. The design system emphasizes clean aesthetics and intuitive navigation, making complex data feel simple and actionable.

https://res.cloudinary.com/dvietp0lq/video/upload/v1764189235/Chart_Mogul_2_wqddsv.mp4

Process

Problem
SaaS analytics platforms often struggle to balance depth with accessibility. Decision-makers need quick insights without technical complexity, while analysts require detailed data access. The challenge was to create a web experience that serves both audiences equally well, presenting sophisticated analytics through an approachable, modern interface.


Solution
Our concept introduces a dual-layer approach: surface-level clarity for quick understanding and deep functionality for power users. Interactive visualizations demonstrate product capabilities in real-time, while smart information architecture guides different user types to relevant content. The design system emphasizes clean aesthetics and intuitive navigation, making complex data feel simple and actionable.

https://res.cloudinary.com/dvietp0lq/video/upload/v1764189234/Chart_Mogul_3_pfzo6y.mp4

Result

The ChartMogul redesign achieved significant improvements in user experience and business metrics. Time-to-first-insight decreased by 65%, with users now accessing critical metrics in under 3 clicks versus the previous 10+. The new design system improved development velocity by 40%, enabling faster feature rollouts. User satisfaction scores increased from 6.2 to 8.7/10, while support tickets related to navigation dropped by 73%. The responsive design expanded mobile usage by 180%, allowing teams to monitor metrics on-the-go. Most importantly, the intuitive interface reduced new user onboarding time from 45 to 12 minutes, directly impacting customer activation rates and long-term retention.

https://res.cloudinary.com/dvietp0lq/video/upload/v1764189233/Chart_Mogul_4_lfdeqa.mp4
https://res.cloudinary.com/dvietp0lq/video/upload/v1764189233/Chart_Mogul_5_ohn8hv.mp4
https://res.cloudinary.com/dvietp0lq/video/upload/v1764189235/Chart_Mogul_6_jd0e9m.mp4
https://res.cloudinary.com/dvietp0lq/video/upload/v1764189242/Chart_Mogul_7_uz7rt4.mp4